ZeoLibrary
The library class ZeoReader imports and parses "zeodata.csv" files, and creates ZeoNight objects for every night. Each ZeoNight object holds sleep data information that originated from the Zeo Sleep Manager sensor readings, and sleep diary information that has been entered through the Zeo website. The library gives you easy access to that data and offers simple functions to compute average data values.
The library class ZeoStream reads in data streamed real-time via a connection to the Zeo Sleep Manager serial port. About every second a ZeoSlice object is read and communicates current raw brainwave data and processed frequency bin data. About every 30 seconds the Sleep Manager communicates the average current sleep stage.
Updates and more documentation for the library can be found on zeolibrary.googlecode.com. Here i will show the results of the examples that are included with the library.
ZeoReader
Example: zeo_readCsv
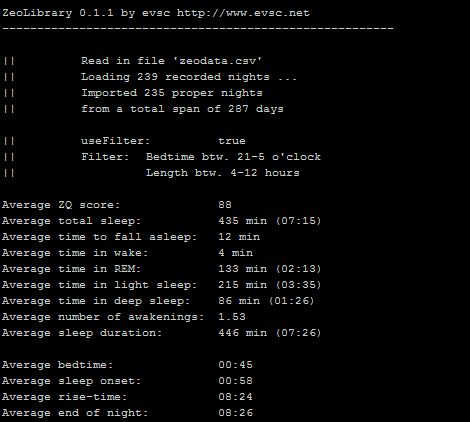
Reads in a "zeodata.csv" file and computes: number of nights, total day span, average sleep time, average time in REM / Light Sleep / Deep Sleep, average bedtime, average sleep onset, ... The results are output directly into the Processing console.
Example: zeo_graphTotalZ
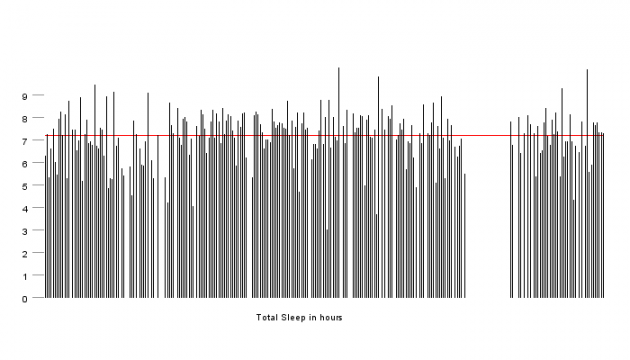
This example takes the total sleep time for every night, and plots it over the total span of days. The white breaks in the graph indicate nights where the sleep sensor was not in use. The red line represents the average total-sleep value of all nights.
Example: zeo_graphStates5min
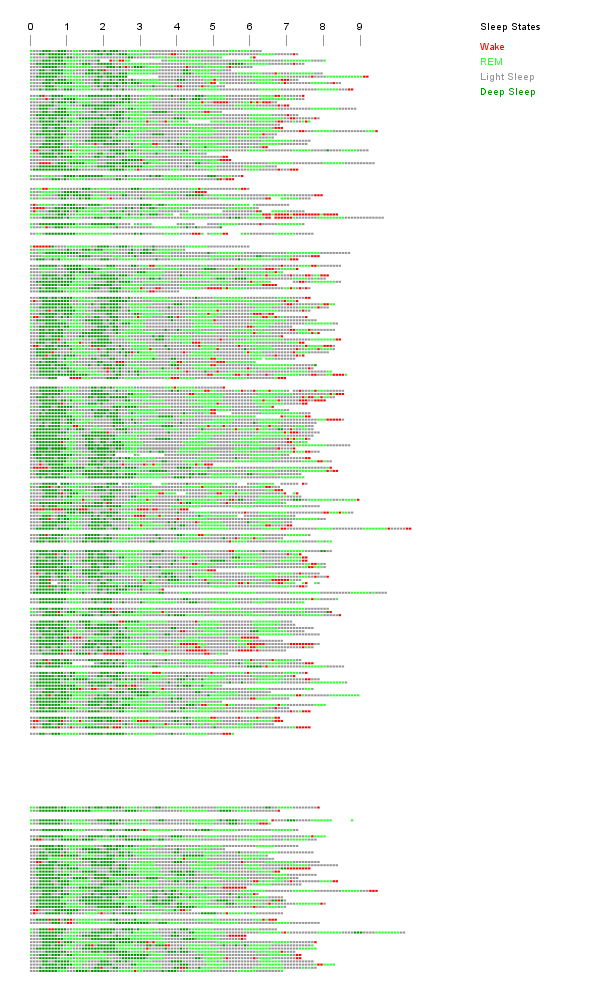
Draws the sleep_graph_5min array for all nights, with colors representing the different sleep states. The graph data starts at the onset of sleep, and nights are aligned on the left.
Example: zeo_graphComparison
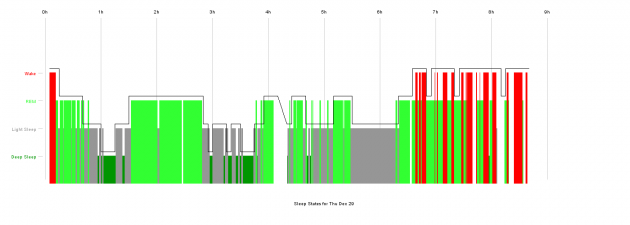
This example draws the sleep_graph_30sec array for one night in a bar graph and the sleep_graph_5min plot as comparison as the black line on top. In typical Zeo's 5-minute segments represent the average of the underlying 30-second segments.
Example: zeo_averageNight
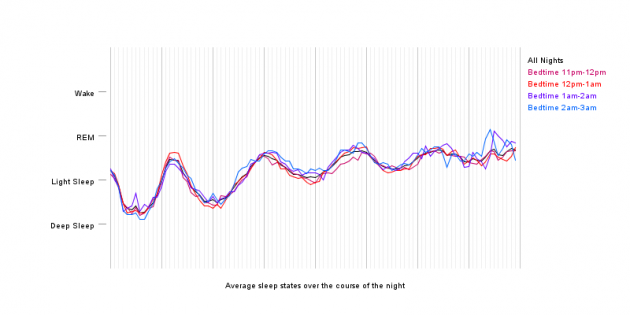
This example computes and plots the average sleep state for every 5-minute segment of all nights, and of groups of nights selected by their sleep-onset value. This plot makes it easy to read out your typical night's cycle time.
ZeoStream
Example: zeoStr_frequencyBins
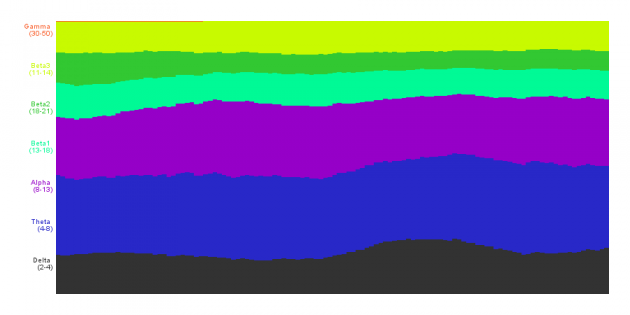
Displays the current levels of Zeo's seven frequency bins.
- 2-4Hz .... DELTA waves
- 4-8Hz .... THETA waves
- 8-13Hz ... ALPHA waves
- 13-18Hz .. BETA1 waves
- 18-21Hz .. BETA2 waves
- 11-14Hz .. BETA3 waves
- 30-50Hz .. GAMMA waves

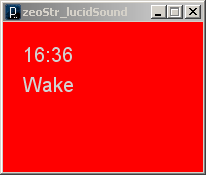
Example: zeoStr_lucidSound
Starts a mp3 sound, about 5 minutes after the REM stage started, to help you become lucid while asleep.
Example: zeoStr_monitor
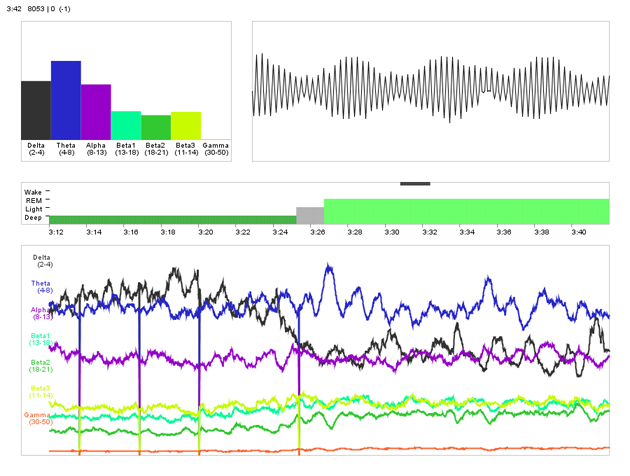
The example displays the current frequency levels and raw brainwave data on top (still need to remove 60Hz noise), and a recording of the frequency data and sleep-stages from the last half hour at the bottom. The application also can take screenshots every half hour.
Example: zeoStr_binPercentage
The example displays the values of the 7 Frequency Bins as percentages, changing over the last 30 seconds.
